
What a Weighted Sum Score is
A Weighted Sum Score (WSS) summarizes a group of related proteins, a
module, as one number per sample. For each module, every
protein is sign-aligned using the sign of its mean_beta
(its association with the core biomarkers), then the module score is the
average of those aligned values, weighted by
mean_alpha_scaled (network connectivity and association
strength). A higher score means more activity of the module in the
direction associated with the core biomarkers.
calculate_WSS() computes these scores from a
samples-by-proteins matrix. By default it uses the bundled
"core_AD_plasma_biomarkers" reference set, which defines 75
modules of plasma proteins built on STRING networks, as described in the
preprint.
You can also supply your own module table.
Proteomic data and what calculate_WSS() expects
Proteomic platforms report different kinds of values:
- SomaLogic SomaScan is aptamer based and reports relative fluorescence units (RFU) per protein.
- TMT-MS (tandem mass tag) reports reporter-ion intensities that are relative within a plex, usually expressed as ratios to a reference channel.
- DIA-MS (data-independent acquisition) reports label-free peptide or protein intensities.
calculate_WSS() does no normalization or
scaling of its input. The matrix you pass must
- have samples as rows and proteins as columns, with column names
matching the
symbolvalues of the module table (gene symbols for the bundled set), - already be normalized and scaled so that proteins are on a comparable scale,
- contain no missing values in the proteins used by a module. Impute, or drop the affected proteins or samples, first.
The scores inherit the scale of the input, so the choice of normalization and scaling matters. The bundled reference set was built from SomaScan data on a rank-based inverse normal transformed (INT) scale, which makes no assumption about the distribution of the values. In our experience, TMT-MS and DIA-MS data processed TAMPOR-style as log2(median ratio) values has worked similarly well without needing a non-parametric transform, only z-scaling (unpublished data).
Two ways to prepare a matrix
The package ships a small simulated matrix,
wss_example_expression, that is already on a z-score-like
scale. To show the two common preparations we first build a mock “raw”
matrix from it. This is purely an illustration: the values are neither
real RFUs nor real intensities.
# Mock raw values: positive and right-skewed, like intensities
raw <- exp(wss_example_expression)
One option is parametric: log2-transform, then z-scale each protein.
The other is a rank-based inverse normal transformation of each protein.
# Rank-based inverse normal transformation, one protein per column
int_values <- apply(raw, 2, RNOmni::RankNorm)
dim(int_values)
#> [1]  50 887
Either matrix can be passed to calculate_WSS(). Scores
computed from differently prepared input are on different scales, so do
not mix them in one analysis.
Calculating scores with the bundled reference set
The simulated matrix has a column for every protein in the default modules, so the default call scores all of them.
res <- calculate_WSS(wss_example_expression)
names(res)
#> [1] "scores"          "summary_stats"   "module_sd"       "module_proteins"
The result is a list with four parts.
scores is the samples-by-modules matrix of module
scores.
dim(res$scores)
#> [1] 50 75
round(head(res$scores[, 1:4], 3), 2)
#>          Merged.M17 Merged.M7 Merged.M4 PlasmaPTau181.M26
#> sample01      -0.87      0.36      0.05              0.69
#> sample02       0.23     -0.50     -0.54             -0.04
#> sample03       0.89     -0.42     -0.57              0.66
summary_stats holds the distribution of each module’s
scores, and module_sd the standard deviation of each
module’s scores across samples.
head(res$summary_stats, 3)
#>        module       Min         Q1      Median         Mean        Q3      Max
#>        <char>     <num>      <num>       <num>        <num>     <num>    <num>
#> 1: Merged.M17 -1.226135 -0.3507488 -0.10019392 -0.005109776 0.3182107 1.703412
#> 2:  Merged.M7 -1.564677 -0.4443154  0.04368833 -0.067000461 0.2798524 1.683075
#> 3:  Merged.M4 -1.422675 -0.3512657  0.01522392  0.007352940 0.3347662 1.409191
round(head(res$module_sd, 3), 2)
#> Merged.M17  Merged.M7  Merged.M4
#>       0.56       0.57       0.62
module_proteins lists the proteins that went into each
scored module.
# Number of proteins per module
summary(lengths(res$module_proteins))
#>    Min. 1st Qu.  Median    Mean 3rd Qu.    Max.
#>    3.00    4.00    6.00   11.83   11.50   93.00
head(res$module_proteins[["Merged.M17"]])
#> [1] "ZWILCH" "SPC25"  "NDC80"  "WEE2"   "CKAP2"  "ZW10"
# Spread of the first eight module scores (simulated data, no biological
# meaning), labeled by module term
terms <- load_prebuilt_terms("core_AD_plasma_biomarkers")
labels <- terms$term[match(colnames(res$scores)[1:8], terms$name)]
par(mar = c(4, 14, 1, 1))
boxplot(res$scores[, 1:8], names = labels, horizontal = TRUE, las = 1,
        cex.axis = 0.7, xlab = "WSS score")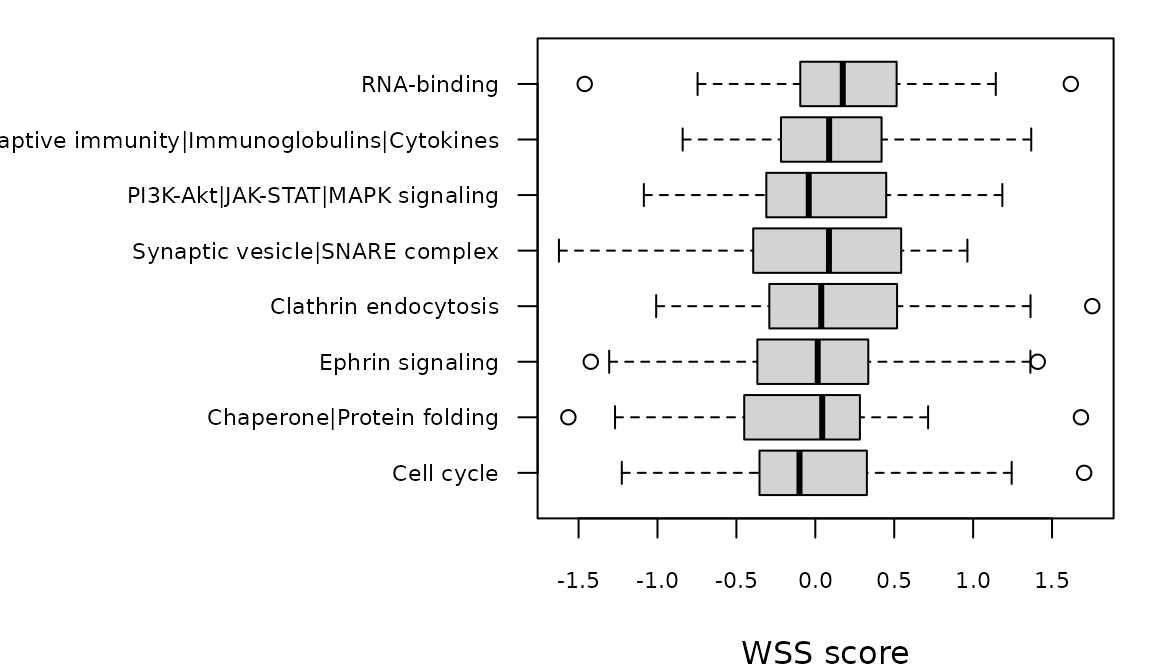
Using your own module table
A module table is a data.table (a data frame is
converted to one) with these columns:
-
module: module name, -
symbol: protein identifier, matching the column names of the matrix, -
mean_beta: its sign sets the direction of alignment, -
mean_alpha_scaled: the weight.
Before scoring, calculate_WSS() cleans the table in two
steps. If a protein is assigned to more than one module, only its
highest-ranked assignment is kept (ranked by dedup_by,
"mean_alpha_scaled" by default). Then modules with fewer
than min_module_size proteins (3 by default) are
dropped.
The next table has three modules. One protein, the first one listed,
is in both modA and modB, with a higher weight
in modA. modC has only two proteins.
proteins <- colnames(wss_example_expression)[1:12]

custom <- data.table::data.table(
  module = c(rep("modA", 5), rep("modB", 6), rep("modC", 2)),
  symbol = c(proteins[1:5], proteins[6:10], proteins[1], proteins[11:12]),
  mean_beta = c(rep(1, 5), rep(-1, 6), rep(1, 2)),
  mean_alpha_scaled = c(0.9, 0.8, 0.7, 0.6, 0.5, 0.9, 0.8, 0.7, 0.6, 0.5, 0.3,
                        0.8, 0.8),
  specificity = c(0.2, 0.2, 0.2, 0.2, 0.2, 0.2, 0.2, 0.2, 0.2, 0.2, 0.9,
                  0.5, 0.5)
)
custom
#>     module   symbol mean_beta mean_alpha_scaled specificity
#>     <char>   <char>     <num>             <num>       <num>
#>  1:   modA   ZWILCH         1               0.9         0.2
#>  2:   modA    HYOU1         1               0.8         0.2
#>  3:   modA    EFNB2         1               0.7         0.2
#>  4:   modA  DNAJB11         1               0.6         0.2
#>  5:   modA HSP90AA1         1               0.5         0.2
#>  6:   modB     DNM2        -1               0.9         0.2
#>  7:   modB    AP2B1        -1               0.8         0.2
#>  8:   modB    CPLX2        -1               0.7         0.2
#>  9:   modB    FGFR1        -1               0.6         0.2
#> 10:   modB      TNF        -1               0.5         0.2
#> 11:   modB   ZWILCH        -1               0.3         0.9
#> 12:   modC HSP90AB1         1               0.8         0.5
#> 13:   modC    EPHA2         1               0.8         0.5
With the defaults, the shared protein stays in modA and
modC is dropped:
custom_res <- calculate_WSS(wss_example_expression, custom)
lengths(custom_res$module_proteins)
#> modA modB
#>    5    5
Ranking duplicates by another column changes which module keeps the
shared protein. Here specificity favors modB,
so modA loses it:
by_specificity <- calculate_WSS(
  wss_example_expression,
  custom,
  dedup_by = "specificity"
)
lengths(by_specificity$module_proteins)
#> modB modA
#>    6    4
Lowering min_module_size keeps the small module:
with_small <- calculate_WSS(
  wss_example_expression,
  custom,
  min_module_size = 2
)
lengths(with_small$module_proteins)
#> modA modB modC
#>    5    5    2
Missing proteins and missing values
If the matrix lacks some of a module’s proteins, the module is scored
from the proteins that are present. If it lacks all of them, the module
gets NA scores and a module_sd of 0, plus a
warning, one per module. To see which modules were actually scored, look
at module_proteins or at all-NA columns in
scores. Note that min_module_size filters the
module table, not the matrix, so a module can be scored from only a few
of its proteins; check module_proteins before relying on a
sparsely covered module.
# Keep only the first 300 proteins; the warnings are suppressed here
partial <- suppressWarnings(calculate_WSS(wss_example_expression[, 1:300]))

# Modules that could be scored, and modules with no proteins in the matrix
length(partial$module_proteins)
#> [1] 50
sum(colSums(is.na(partial$scores)) == nrow(partial$scores))
#> [1] 25
Missing values within the matrix are different: they are not
supported for the proteins a module uses. calculate_WSS()
stops with an error that names the affected proteins, so impute the
values, or drop the affected proteins or samples, before calling it.
Missing values in proteins that no module uses are ignored.
# One missing value in a protein that a module uses
with_na <- wss_example_expression
with_na[1, 2] <- NA

# calculate_WSS() stops and names the affected protein
tryCatch(calculate_WSS(with_na), error = function(e) conditionMessage(e))
#> [1] "`expr_matrix` has missing values (NA) in 1 protein(s) used by the modules, e.g. HYOU1. calculate_WSS() does not handle missing values; impute them, or drop the affected proteins or samples, before scoring."
Scoring new samples against a reference cohort
With INT, the transformed value of a sample depends on the other
samples it is ranked with. To score new samples on the same scale as a
reference cohort without changing the reference, rank-normalize the
reference cohort in-sample and use project_rank_norm() to
place each new value within the frozen reference.
Here the first 40 mock samples play the reference cohort and the last 10 the new samples.
reference_rows <- 1:40
new_rows <- 41:50

# Rank-normalize the reference cohort in-sample, one protein per column
reference_int <- apply(raw[reference_rows, ], 2, RNOmni::RankNorm)

# Project each new sample onto the frozen reference, protein by protein
new_int <- vapply(
  colnames(raw),
  function(protein) {
    project_rank_norm(raw[reference_rows, protein], raw[new_rows, protein])
  },
  numeric(length(new_rows))
)
rownames(new_int) <- rownames(raw)[new_rows]
With the reference and the new samples on the same INT scale, both can be scored in the same way:
reference_scores <- calculate_WSS(reference_int)
new_scores <- calculate_WSS(new_int)

dim(reference_scores$scores)
#> [1] 40 75
dim(new_scores$scores)
#> [1] 10 75
The package bundles a reference distribution only for the plasma
biomarkers used by predict_WSS(). For proteins, supply your
own reference cohort. The vignette Exploring the bundled datasets
describes that reference and the other bundled files.
Interpreting and comparing scores
- Scores are on the scale of the input, so compare scores only when they were computed from input prepared the same way.
-
predict_WSS()predicts module scores on the INT-based scale of the bundled reference. Scores computed from other scalings, such as z-scaled log2 ratios, are not directly comparable with its predictions. The vignette Predicting Weighted Sum Scores from plasma biomarkers covers that function. - The data in this vignette are simulated and have no biological meaning.